This website uses Cookies. Click Accept to agree to our website's cookie use as described in our Privacy Policy. Click Preferences to customize your cookie settings.
- JMP User Community
- :
- Discussions
- :
- Re: How do i add error bars in chart builder using a var as the error term
Turn on suggestions
Auto-suggest helps you quickly narrow down your search results by suggesting possible matches as you type.
Topic Options
- Subscribe to RSS Feed
- Mark Topic as New
- Mark Topic as Read
- Float this Topic for Current User
- Bookmark
- Subscribe
- Printer Friendly Page

Level I
- Mark as New
- Bookmark
- Subscribe
- Mute
- Subscribe to RSS Feed
- Get Direct Link
- Report Inappropriate Content
How do i add error bars in chart builder using a var as the error term
Dec 24, 2023 03:41 AM
(1208 views)
I have a dataset with the mean and SD as columns of data and i want to make a simple line graph with error +/- SD. This seem extraordinarily difficult if not impossible to do in JMP ..
of couse it is not that simple .. i have several groups of Y +/- SD using the same X ... but i would be happy to just get one simple set ...
appreciate any help ... with all JMP can do this should be easy. ie not require coding ..
thanks in advance
Tom
6 REPLIES 6

Super User
- Mark as New
- Bookmark
- Subscribe
- Mute
- Subscribe to RSS Feed
- Get Direct Link
- Report Inappropriate Content
Re: How do i add error bars in chart builder using a var as the error term
Created:
Dec 24, 2023 04:08 AM
| Last Modified: Dec 24, 2023 04:10 AM
(1201 views)
| Posted in reply to message from tcoates 12-24-2023
Could you provide example data and some sort example graph of what you want to do?
Edit:
This might give some ideas How to create custom error bars in Graph Builder
-Jarmo
Level I
- Mark as New
- Bookmark
- Subscribe
- Mute
- Subscribe to RSS Feed
- Get Direct Link
- Report Inappropriate Content
Re: How do i add error bars in chart builder using a var as the error term
Thanks ... the instructions in the article seem to do what i want, but it sure is complicated. (create a line fraph with error bars). I will give it a try one problem is my X axis is numeric. This the article in the link you provided was from 2017. Seems since then JMP would have added an error-bar option. I finally make the graph in Excel, which it not my favorite graphing program. In excel, it took me a while to figure how to jitter the data so the error bars would not overlap.
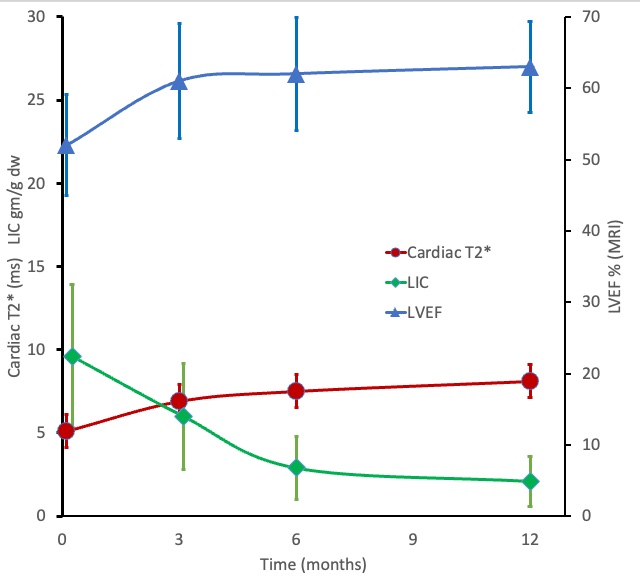
I attached the graph i made in Excel. You can see the jittered error bars at 0, 3 .. in data set there was in the. form. X Y1 SDY1 Y2 SDY2 Y3 SD Y3.
I plotted in Excel by making 3 copies of the X axis ... and then manually editing the corresponding X value to achieve the Jitter at 0, 3. This is clearly brute-force ... but worked
I attached the Excel sheet as well, if you want to play. I would really like to be able to create a column in JMP and tell JMP that COL2 is the Error for COL1.
Thanks for the response ......
tom
Tom

Staff
- Mark as New
- Bookmark
- Subscribe
- Mute
- Subscribe to RSS Feed
- Get Direct Link
- Report Inappropriate Content
Re: How do i add error bars in chart builder using a var as the error term
While Graph Builder allows multiple variables in the Y role, they all share the same Interval variable. Here's what I was able to get in JMP after stacking the variables into two columns, one for data and one for SD, and then using the SD column in the Interval role. I used the Local Data Filter to only show the three measures on interest and used a duplicated/split axis instead of your left/right axes.


Super User
- Mark as New
- Bookmark
- Subscribe
- Mute
- Subscribe to RSS Feed
- Get Direct Link
- Report Inappropriate Content
Re: How do i add error bars in chart builder using a var as the error term
Hi,
Have you tried to assign your error column to the Interval variable in the Graph Builder window?

Also, if you have asymmetrical errors, you can assign two columns to the Interval variable to define the upper and lower boundaries of the error range.
Sorry if this is too simplistic for your case.
Best,
TS
Thierry R. Sornasse
Super User
- Mark as New
- Bookmark
- Subscribe
- Mute
- Subscribe to RSS Feed
- Get Direct Link
- Report Inappropriate Content
Re: How do i add error bars in chart builder using a var as the error term
One more note:
Your Xs, Ys, and SDs need to be stacked (i.e., one column for each X, Y, and SD)
Thierry R. Sornasse

Super User
- Mark as New
- Bookmark
- Subscribe
- Mute
- Subscribe to RSS Feed
- Get Direct Link
- Report Inappropriate Content
Re: How do i add error bars in chart builder using a var as the error term
As noted previously in the link from Xan, when you have more than one overlay variable the "jitter" is too large. As Thierry mentioned you need to stack your data. Here's an example with two Y variables. Done in JMP 18 Early Adopter, but will work in versions 14, 15 and 16 as well.
Here's the graph. Note the too-large jitter. If someone knows how to remove the jitter please let us know!

Here's the code.
dt = New Table( "Error Bar Demo", Add Rows( 12 ),
	New Column( "Interval", Numeric, "Continuous", Format( "Best", 12 ),
		Set Values( [1, 2, 3, 4, 5, 6, 1, 2, 3, 4, 5, 6] )),
	New Column( "Y", Numeric, "Continuous", Format( "Best", 12 ),
		Set Values(
			[12.437490886321333, 37.199168332879417, 37.156578932774323,
			35.050996731864814, 30.322353371355184, 8.0614203454894433,
			3.859910964720414, 12.621146398655515, 17.191849953970209,
			10.367196216467057, 12.039757956273382, 3.45489443378119] )),
	New Column( "LCL", Numeric, "Continuous", Format( "Best", 12 ),
		Set Values(
			[7.2927397683889579, 25.642305959980376, 26.50551265292761,
			25.263402819677477, 21.688274852565598, 4.2492252022016492,
			1.3434215718643505, 6.4065309646179331, 10.278623145692858,
			5.4646141190032171, 6.907533049594635, 1.2024577129570946] )),
	New Column( "UCL", Numeric, "Continuous", Format( "Best", 12 ),
		Set Values(
			[19.718075997278717, 52.024792167595514, 50.529174751416292,
			47.259229019802909, 41.144254937530874, 13.798954022840528,
			8.5769036465305053, 22.175341545759608, 26.863128886056295,
			17.745813740731023, 19.39599547859639, 7.6769378719651895] )),
	New Column( "Label", Character, "Nominal",
		Set Values( {"BTD", "BTD", "BTD", "BTD", "BTD", "BTD",
					 "DI", "DI", "DI", "DI", "DI", "DI"} )
	)
);

dt << Graph Builder(
	Show Control Panel( 0 ),
	Variables(
		X( :Interval ),
		Y( :Y ),
		Y( :LCL, Position( 1 ) ),
		Y( :UCL, Position( 1 ) ),
		Overlay( :Label )
	),
	Elements(
		Points( X, Y( 1 ), Legend( 15 ), Jitter( "None" ) ),
		Line( X, Y( 1 ), Legend( 17 ) ),
		Bar( X, Y( 2 ), Y( 3 ), Legend( 18 ), Bar Style( "Interval" ))
	),
	SendToReport(
		Dispatch( {}, "Interval", ScaleBox, {Label Row( Show Major Grid( 1 ) )} ),
		Dispatch( {}, "Y", ScaleBox, {Label Row( Show Major Grid( 1 ) )} )
	)
);
If you stack your data and follow Xan's directions you'll be able to do this without writing JSL.
- © 2024 JMP Statistical Discovery LLC. All Rights Reserved.
- Terms of Use
- Privacy Statement
- About JMP
- JMP Software
- JMP User Community
- Contact