- JMP User Community
- :
- Blogs
- :
- JMP Blog
- :
- How long will it last? A deeper look at retirement scenarios
- Subscribe to RSS Feed
- Mark as New
- Mark as Read
- Bookmark
- Subscribe
- Printer Friendly Page
- Report Inappropriate Content
Before we start, we should reiterate that we are two guys reading retirement planning articles and saying, “What if?” These blog posts are in no way meant as financial advice. They are simply meant to be educational and to show the power of JMP for analyzing and visualizing data. Our best advice is to consult a licensed professional for all of your retirement planning needs.
In the previous post, Pete Hersh (@Peter_Hersh) asked whether he could expect his retirement to last 40 years. In response, we said it depended on how much retirement you had when there was a market downturn. Retirements starting in the years 1961–1964 illustrate this beautifully. With a 2.5% inflation adjusted withdrawal rate and a 40-year retirement horizon, 1961 and 1963 made it all the way through with money to spare. After 40 years, your retirement account would be 40% larger than when you started in 1963. The year 1961 fared much better, with a retirement balance 280% of its original value. The years 1962 and 1964 didn’t do well at all. In fact, both ran out of money after 34 years. The difference appears to be how much each account year had after the market downturn years of 1973 (-18.0%) and 1974 (-21.1%).
|
Retirement Year Start |
Balance at End of 1973 |
Balance at Beginning of 1975 |
|
1961 |
1.5430 |
0.8381 |
|
1962 |
1.2075 |
0.6407 |
|
1963 |
1.4765 |
0.8003 |
|
1964 |
1.2092 |
0.6438 |
While at first glance the difference between 1961/1963 and 1962/1964 doesn’t seem like much, it made a substantial difference in terms of results. There just wasn’t enough left of the retirement balances for 1962 and 1964 to recover when the market did improve.
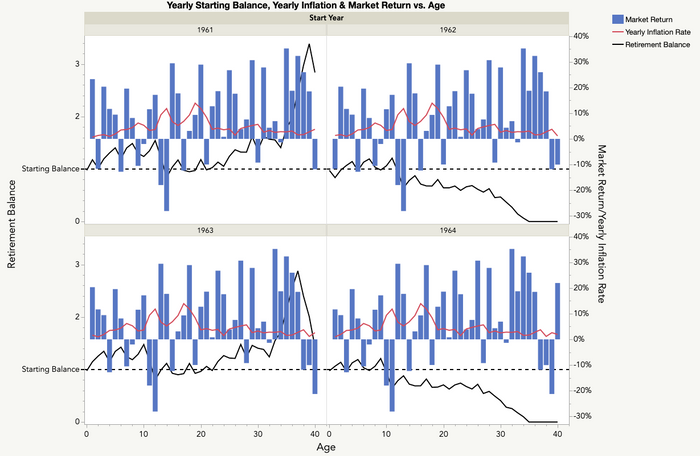
So, whether retirement balance can sustain withdrawals for the entire planned horizon will depend on how the market effects the balance. There are, however, mathematical ways to avoid a retirement balance going to zero prematurely. You could, for example, withdraw a fraction of the remaining balance rather than a set amount. This would guarantee a non-zero balance in perpetuity, assuming the fraction was less than 1. But would the withdrawals be enough? Would we just be postponing the inevitable, reducing our income over our remaining years rather than withdrawing what was planned? Would our retirement balance have recovered without this intervention anyway? Why tighten our belts needlessly?
In this post, we’ll investigate what happens if each year we were to withdraw the lesser of the planned (inflation adjusted) amount and the remaining balance divided by the number of years remaining in our retirement horizon. If, for example, in a given year the planned withdrawal was 8% of the initial retirement balance and the current retirement balance is 1.0 with 10 years remaining, we would withdraw 8% (8% < 1/10 = 10%). If the balance were 0.75, however, we would withdrawal 7.5%, instead. Because we can always divide our remaining balance into equal fractions, there will always be something left until possibly the very end. We’ll call this the Hybrid approach.
The script attached below, Retirement Scenarios, is a modification of the script from the previous post that includes this approach. We will compare it to the inflation-adjusted withdrawal approach using the historical data focusing on a 2.5% base withdrawal rate and 40-year horizon.
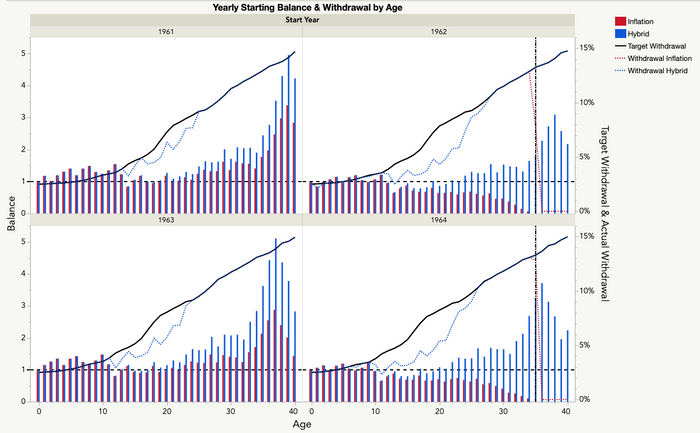
The graph below shows the results for 1961–1964. As expected under the Hybrid approach, 1962 and 1964 balances never reached zero. A horizontal dashed line is drawn at 1, the starting balance, and a vertical dash‑dot-dot gives the year that Inflation balance hits zero. A few interesting things to note. The 1962 and 1964 retirements not only avoid going to zero, but eventually grow to about 2X their initial value. The difference between planned and Hybrid withdrawals is most noticeable at about 10 years and continues for approximately 15 years, after which the two coincide. Lastly, both 1961 and 1963 have periods of reduced withdrawals despite not needing them to maintain a non-zero balance.
To get a better understanding of how the two approaches compare, we looked at both the summed difference between planned and actual withdrawals over the retirement horizon as well as the ending retirement account balance. We scaled the yearly differences by the planned withdrawal rate because we felt it better to represent these values by proportions than absolute values.
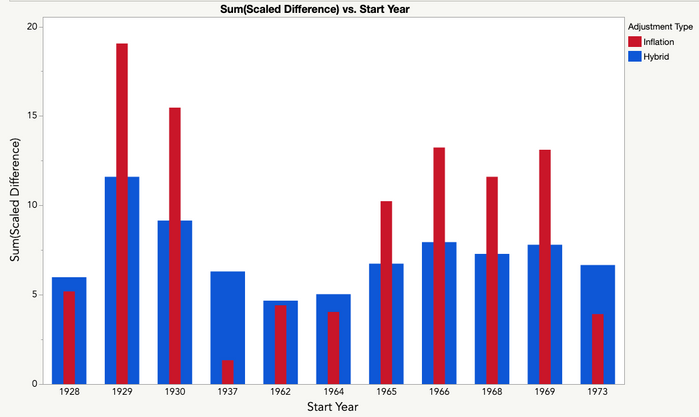
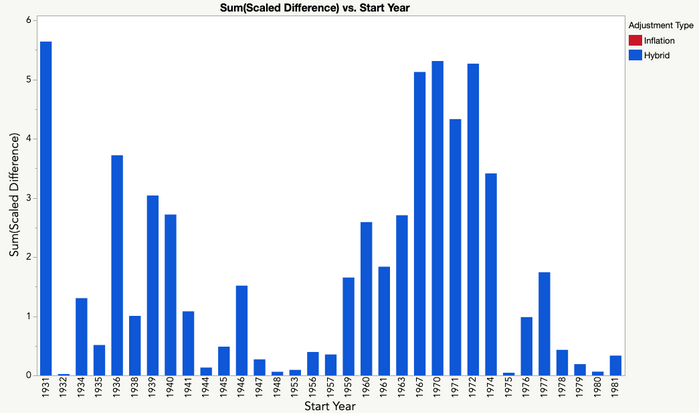
The graphs below, giving the scaled and summed differences, shows the volatility of the Inflation approach. The large spikes correspond to those years where the balance prematurely went to zero. Looking at just those years, we see that the Inflation approach still provided more total income than the Hybrid approach in 4 of the 11 years.
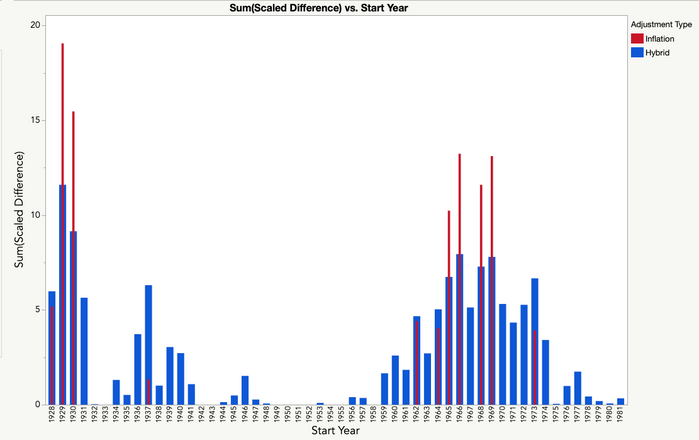
In 10 of the 54 starting years, there was no difference between planned and actual withdrawals for either approach (1933, 1942, 1943, 1949 – 1952, 1954, 1955, and 1958). In 33 years, the Hybrid approach had a non-zero value, but Inflation did not. In two-thirds of these cases (22/33), the discrepancy was two or less, or about two years of income. The remaining 11 cases (1931, 1936, 1939, 1940, 1960, 1963, 1967, 1970 – 1972, 1974) ranged between 2.5 and 5.7. Four of the cases were greater than five.
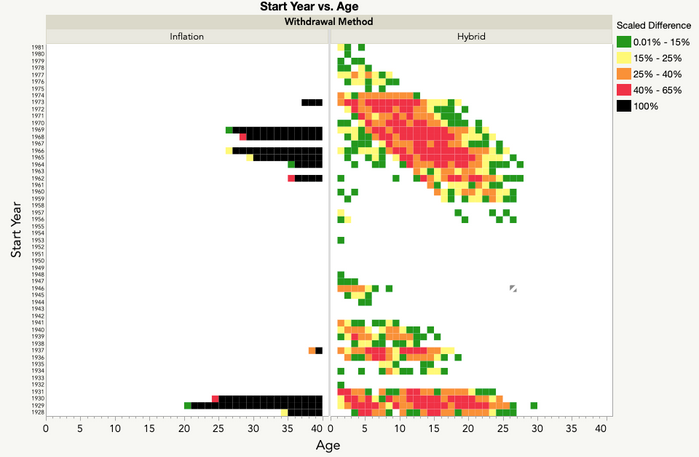
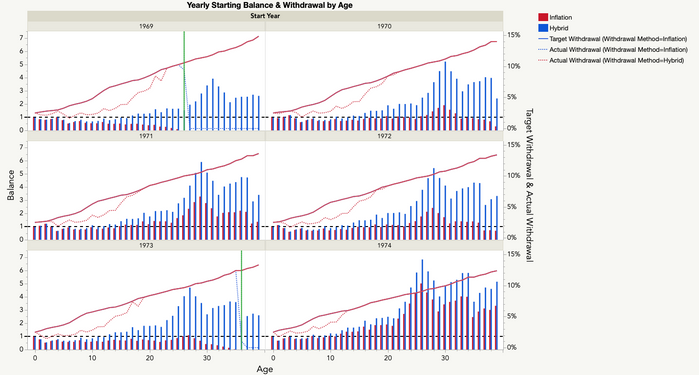
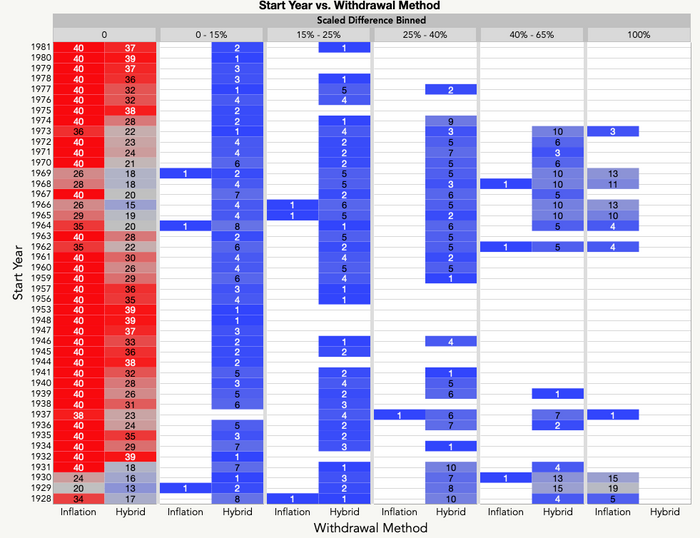
Looking at the yearly data below, we see that although withdrawal reductions up to 65% for Hybrid occurred in years where Inflation ran out of money, periods of reduced income were present even in years when the Inflation method did not run out of money. During these periods, the market returns were such that the balance recovered enough that Inflation balance did not go to zero. Timing was everything. Whether retirement started one year or the next could be as different as running out of money prematurely or making it to the end, as illustrated above with 1961–1964, and below for 1969–1974.
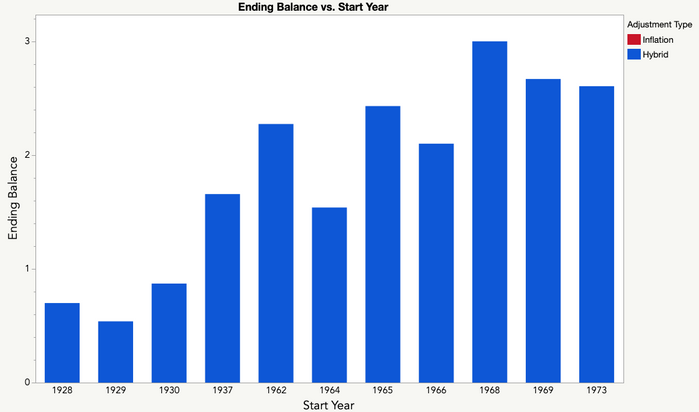
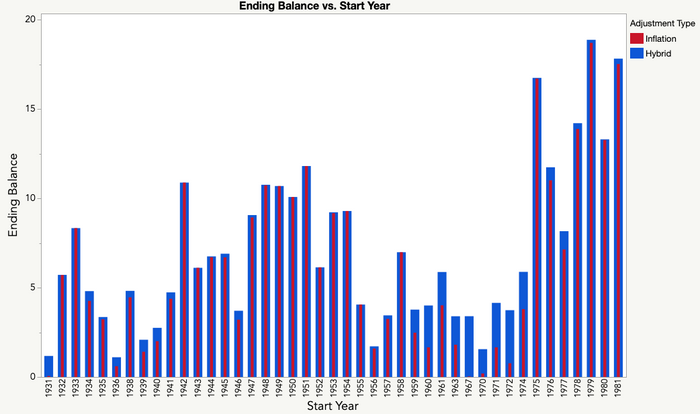
Considering ending balance, the Hybrid method performed uniformly better. For years where Inflation ran out of money, the Hybrid approach left the balance greater than where it started in all but three cases. Ending balance for both methods was very similar for the other years, with a few exceptions during the period 1959–1974.
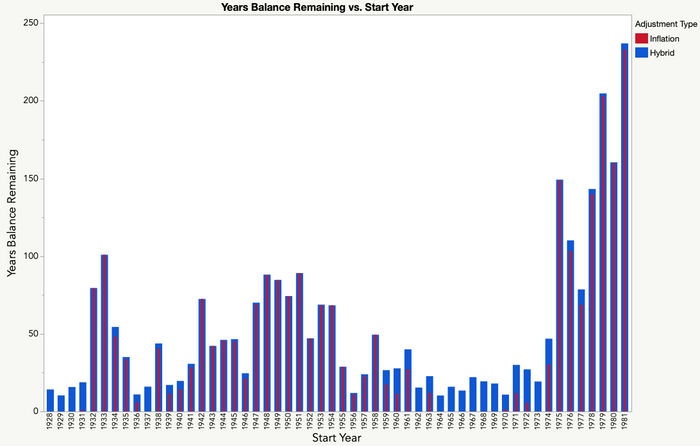
Combining the two metrics, we calculated years balance remaining, the remaining balance less the withdrawal differential divided by inflation indexed withdrawal rate. Surprisingly, while the Inflation method ran out of money in 11 cases, the minimum years balance remaining for Hybrid was 10. Nearly half the cases (26/54) were 40 or better.
In summary, applying the Hybrid approach to historical market data not only kept retirement balance from reaching zero, but finished with a balance at or above where it started for all but three years (1928, 1929, 1930). In nearly half the cases, the balance was large enough to fund a second 40-year period even when taking inflation into consideration. This was done at the expense of austerity, in particular during the 1960s and early 1970s where withdrawals were reduced 40-65% for as many as 10 of the 40 years.
The common wisdom is that adding bonds to a portfolio will lessen the volatility. Next time, we’ll be looking at how different mixes of stocks and bonds would have played out historically.
- © 2024 JMP Statistical Discovery LLC. All Rights Reserved.
- Terms of Use
- Privacy Statement
- About JMP
- JMP Software
- JMP User Community
- Contact

You must be a registered user to add a comment. If you've already registered, sign in. Otherwise, register and sign in.