- JMP User Community
- :
- Blogs
- :
- JMP Blog
- :
- Need for Speed: Predictor Screening
- Subscribe to RSS Feed
- Mark as New
- Mark as Read
- Bookmark
- Subscribe
- Printer Friendly Page
- Report Inappropriate Content
Hello! Welcome to today’s Need for Speed! Today is all about Predictor Screening! For previous Need for Speed posts, click here!

After I demonstrate how quickly JMP can perform your routine data manipulation and analyses compared to other tools, I’ll show you the quickest way to get it done within JMP.
Predictor Screening
Do you have large data sets that contain many input variables…maybe dozens or even hundreds of input variables!?
Do you need to quickly determine which of these large number of candidates are the most significant in their ability to predict an outcome of interest!?
Well…put on your wind-resistant jacket immediately, because you are going to be blown away by the capability, and most important, the speed of JMP’s Predictor Screening platform!
Predictor Screening platform
The Predictor Screening platform uses a bootstrap forest model to screen for potentially important predictors of your response.
Go to the Screening menu under Analyze, and select Predictor Screening. A new window now appears. All you need to do here is two simple drag-and-drop clicks! One is for adding your desired output(s), and the other is for adding your inputs.
In the example below, after selecting Dissolution as my output of interest, I drop it in the box next to Y, Response. I then select all 17 inputs, and drop them in the box next to X.
The default setting is to build a bootstrap forest model using 100 decision trees, but the number of trees can always be modified at the bottom of the window.
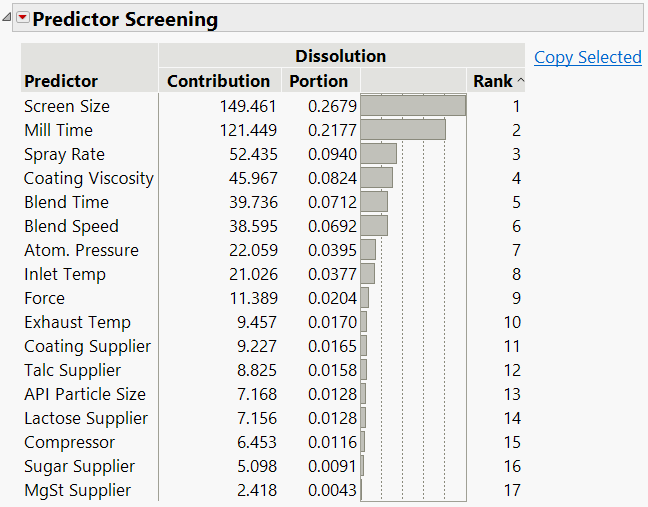
After clicking OK, the predictor screening report is created. Boom! Your predictors are ranked from highest to lowest contribution in the bootstrap forest model. Predictors with the highest contributions are likely to be important in predicting your response. The resulting table will also have a portion column showing the proportion of the variation in the response attributed to a predictor. The best part is that all of this was done in less than a minute!
In the example above, Screen Size, Mill Time, Spray Rate, Coating Viscosity, Blend Time, and Blend Speed are the top six most important variables, and the sum of their portion values is just over 80%.
The top predictors can then easily be copied and pasted into another analysis window for further study. All you need to do is highlight the predictors of interest and click on the Copy Selected link to the right of the table.
In the example below, watch as I select the top six ranked predictors and easily copy them as model effects in the Fit Model platform. No need to waste your precious time finding each variable individually and then adding them!
On that note,
is clicking out!
You must be a registered user to add a comment. If you've already registered, sign in. Otherwise, register and sign in.
- © 2024 JMP Statistical Discovery LLC. All Rights Reserved.
- Terms of Use
- Privacy Statement
- About JMP
- JMP Software
- JMP User Community
- Contact


