This website uses Cookies. Click Accept to agree to our website's cookie use as described in our Privacy Policy. Click Preferences to customize your cookie settings.
- JMP User Community
- :
- Discussions
- :
- Re: DOE and UV-VIS analysis as response
Turn on suggestions
Auto-suggest helps you quickly narrow down your search results by suggesting possible matches as you type.
Topic Options
- Subscribe to RSS Feed
- Mark Topic as New
- Mark Topic as Read
- Float this Topic for Current User
- Bookmark
- Subscribe
- Printer Friendly Page

Level III
- Mark as New
- Bookmark
- Subscribe
- Mute
- Subscribe to RSS Feed
- Get Direct Link
- Report Inappropriate Content
DOE and UV-VIS analysis as response
Created:
Jul 18, 2022 01:10 PM
| Last Modified: Jun 8, 2023 05:10 PM
(1246 views)
Hi,
We did DoE for reaction conditions the factors were concentration, temperature, sequence and duration. one of the responses is UV-vis peak, actually we are looking for a new interesting peak or peak shift. what is the best way to handle this as response?
since the concentrations of the product are not exactly the same - I can not use the intensity
any recommendations regarding the graphical design of the plots will be more then welcome
thanks for your advice
4 ACCEPTED SOLUTIONS
Accepted Solutions

Staff
Solution
- Mark as New
- Bookmark
- Subscribe
- Mute
- Subscribe to RSS Feed
- Get Direct Link
- Report Inappropriate Content
Re: DOE and UV-VIS analysis as response
Please see the Functional Data Explorer in JMP Pro. You can treat each spectrum as a 'data point' for the response. You can model this as you would a scalar response. You can optimize the spectrum with the factor settings, and so on.

Super User
Solution
- Mark as New
- Bookmark
- Subscribe
- Mute
- Subscribe to RSS Feed
- Get Direct Link
- Report Inappropriate Content
Re: DOE and UV-VIS analysis as response
Created:
Jul 18, 2022 02:22 PM
| Last Modified: Jul 25, 2022 08:27 AM
(1227 views)
| Posted in reply to message from YanivD 07-18-2022
Hi @YanivD,
Just to add to the excellent suggestion by @Mark_Bailey, you can find some very useful content provided by @Bill_Worley about pre-processing of spectroscopic data that might help you leverage UV data in the most optimal way: Analyzing spectroscopic data: Pre-processing
Hope this will help you,
Victor GUILLER
Scientific Expertise Engineer
L'Oréal - Data & Analytics
Scientific Expertise Engineer
L'Oréal - Data & Analytics

Staff
Solution
- Mark as New
- Bookmark
- Subscribe
- Mute
- Subscribe to RSS Feed
- Get Direct Link
- Report Inappropriate Content
Re: DOE and UV-VIS analysis as response
Thank you @Victor_G for pointing out our blog on pre-processing spectral data.
@YanivD Victor makes a good point. In looking at your curves it appears you have some additive effects that Standard Normal Variate will help clean up. It will also help with multiplicative effects. I typically try Savitzy-Golay 1st derivative as well, and if I use both pre-processing methods, I do the Savitzy-Golay derivative first.
@Mark_Bailey also makes a great point regarding FDE. It is one of the best ways going to analyze "curve" data based on a DOE. After you model the curves you select FDOE and you can use your other inputs to predict the shape of the spectra
Let me know if you would like to discuss further.
Kind regards,
Bill
Super User
Solution
- Mark as New
- Bookmark
- Subscribe
- Mute
- Subscribe to RSS Feed
- Get Direct Link
- Report Inappropriate Content
Re: DOE and UV-VIS analysis as response
In the FDE Platforms, you will have to choose the best model (between B-Splines, P-Splines and Wavelets models), and then extract the functional principal components (number of FPCs depends on how much variability you want to keep and how informative each FPC is for the model (information criterion like AICc or BIC), in order to avoid overfitting).
These FPCs correspond to the changes between curves and help model back the original experimental curves (with the corresponding mean curve and eigenfunctions), so you can keep them as a response and create a model linking your DoE factors to these FPCs to have an understanding about how each factor(s) change the curve.
If you have a "golden curve" you're trying to match, there is an option in the FDE to add this curve as a reference, and you'll have in the FDOE profiler complementary infos about how the changes in factors make your experimental curves deviate or approach from the golden curve.
Victor GUILLER
Scientific Expertise Engineer
L'Oréal - Data & Analytics
Scientific Expertise Engineer
L'Oréal - Data & Analytics
9 REPLIES 9
Staff
Solution
- Mark as New
- Bookmark
- Subscribe
- Mute
- Subscribe to RSS Feed
- Get Direct Link
- Report Inappropriate Content
Re: DOE and UV-VIS analysis as response
Please see the Functional Data Explorer in JMP Pro. You can treat each spectrum as a 'data point' for the response. You can model this as you would a scalar response. You can optimize the spectrum with the factor settings, and so on.
Super User
Solution
- Mark as New
- Bookmark
- Subscribe
- Mute
- Subscribe to RSS Feed
- Get Direct Link
- Report Inappropriate Content
Re: DOE and UV-VIS analysis as response
Created:
Jul 18, 2022 02:22 PM
| Last Modified: Jul 25, 2022 08:27 AM
(1228 views)
| Posted in reply to message from YanivD 07-18-2022
Hi @YanivD,
Just to add to the excellent suggestion by @Mark_Bailey, you can find some very useful content provided by @Bill_Worley about pre-processing of spectroscopic data that might help you leverage UV data in the most optimal way: Analyzing spectroscopic data: Pre-processing
Hope this will help you,
Victor GUILLER
Scientific Expertise Engineer
L'Oréal - Data & Analytics
Scientific Expertise Engineer
L'Oréal - Data & Analytics
Staff
Solution
- Mark as New
- Bookmark
- Subscribe
- Mute
- Subscribe to RSS Feed
- Get Direct Link
- Report Inappropriate Content
Re: DOE and UV-VIS analysis as response
Thank you @Victor_G for pointing out our blog on pre-processing spectral data.
@YanivD Victor makes a good point. In looking at your curves it appears you have some additive effects that Standard Normal Variate will help clean up. It will also help with multiplicative effects. I typically try Savitzy-Golay 1st derivative as well, and if I use both pre-processing methods, I do the Savitzy-Golay derivative first.
@Mark_Bailey also makes a great point regarding FDE. It is one of the best ways going to analyze "curve" data based on a DOE. After you model the curves you select FDOE and you can use your other inputs to predict the shape of the spectra
Let me know if you would like to discuss further.
Kind regards,
Bill
Level III
- Mark as New
- Bookmark
- Subscribe
- Mute
- Subscribe to RSS Feed
- Get Direct Link
- Report Inappropriate Content
Re: DOE and UV-VIS analysis as response
@Bill_Worley thank you and also @Victor_G , it was helpful information - really appreciated. but as you know i have to put some data in the DOE table. how do i take it out from the curves? please advice
attached is the FDE of the curves with 2 references - part of the spectra is like the reference and part of the runs gave something else.

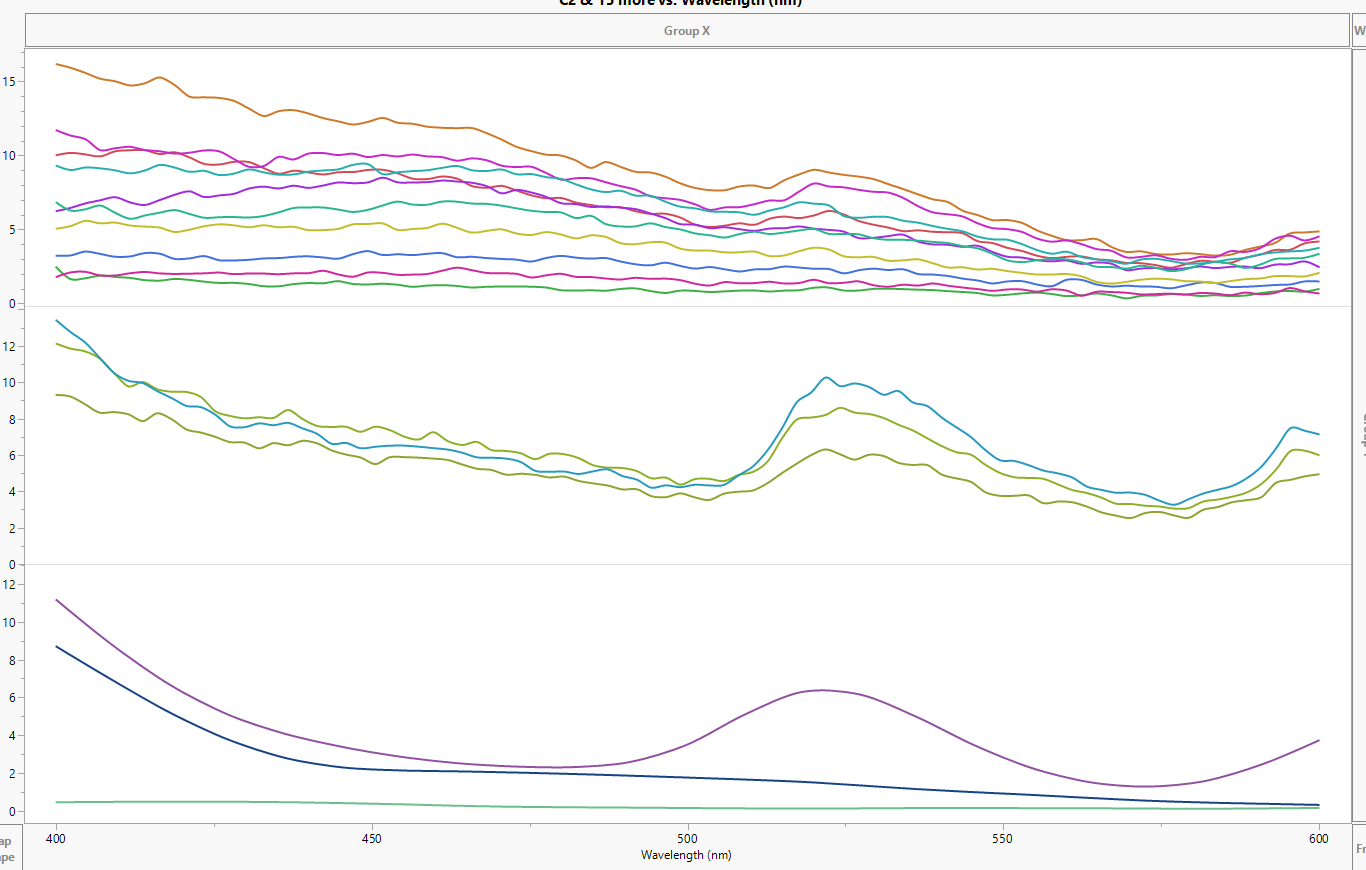
Staff
- Mark as New
- Bookmark
- Subscribe
- Mute
- Subscribe to RSS Feed
- Get Direct Link
- Report Inappropriate Content
Re: DOE and UV-VIS analysis as response
@YanivD It would be difficult to succinctly explain what the best modeling approach will be for your data in this reply so, I will direct you to two more blogs that will help you get to the desired endpoint.
The first is for multivariate analysis and advanced pre-processing and the second is for modeling your spectral data which includes FDE/FDOE as an option. Please review these blog pages and let me know how I can be of help.
Analyzing spectral data: Multivariate methods and advanced pre-processing (jmp.com)
Analyzing spectral data: Modeling options (jmp.com)
Kind regards,
Bill
Level III
- Mark as New
- Bookmark
- Subscribe
- Mute
- Subscribe to RSS Feed
- Get Direct Link
- Report Inappropriate Content
Re: DOE and UV-VIS analysis as response
thanks @Bill_Worley that was quick reply
Super User
Solution
- Mark as New
- Bookmark
- Subscribe
- Mute
- Subscribe to RSS Feed
- Get Direct Link
- Report Inappropriate Content
Re: DOE and UV-VIS analysis as response
In the FDE Platforms, you will have to choose the best model (between B-Splines, P-Splines and Wavelets models), and then extract the functional principal components (number of FPCs depends on how much variability you want to keep and how informative each FPC is for the model (information criterion like AICc or BIC), in order to avoid overfitting).
These FPCs correspond to the changes between curves and help model back the original experimental curves (with the corresponding mean curve and eigenfunctions), so you can keep them as a response and create a model linking your DoE factors to these FPCs to have an understanding about how each factor(s) change the curve.
If you have a "golden curve" you're trying to match, there is an option in the FDE to add this curve as a reference, and you'll have in the FDOE profiler complementary infos about how the changes in factors make your experimental curves deviate or approach from the golden curve.
These FPCs correspond to the changes between curves and help model back the original experimental curves (with the corresponding mean curve and eigenfunctions), so you can keep them as a response and create a model linking your DoE factors to these FPCs to have an understanding about how each factor(s) change the curve.
If you have a "golden curve" you're trying to match, there is an option in the FDE to add this curve as a reference, and you'll have in the FDOE profiler complementary infos about how the changes in factors make your experimental curves deviate or approach from the golden curve.
Victor GUILLER
Scientific Expertise Engineer
L'Oréal - Data & Analytics
Scientific Expertise Engineer
L'Oréal - Data & Analytics
Level III
- Mark as New
- Bookmark
- Subscribe
- Mute
- Subscribe to RSS Feed
- Get Direct Link
- Report Inappropriate Content
Re: DOE and UV-VIS analysis as response
going to try this @Victor_G thank you so much

Staff
- Mark as New
- Bookmark
- Subscribe
- Mute
- Subscribe to RSS Feed
- Get Direct Link
- Report Inappropriate Content
Re: DOE and UV-VIS analysis as response
This short video demo that I recorded might help. In this case study the "functional" response is particle size vs time but the same method applies to a spectral functional response (Intensity vs wavelength) as you have. I recorded this using JMP Pro 15. I think it should be very similar in JMP Pro 16.
- © 2024 JMP Statistical Discovery LLC. All Rights Reserved.
- Terms of Use
- Privacy Statement
- About JMP
- JMP Software
- JMP User Community
- Contact