- JMP User Community
- :
- Discussions
- :
- Re: How to find the best combination of existing historical DOEs with lowest cor...
- Subscribe to RSS Feed
- Mark Topic as New
- Mark Topic as Read
- Float this Topic for Current User
- Bookmark
- Subscribe
- Printer Friendly Page
- Mark as New
- Bookmark
- Subscribe
- Mute
- Subscribe to RSS Feed
- Get Direct Link
- Report Inappropriate Content
How to find the best combination of existing historical DOEs with lowest correlations (JMP17)?
I have 30 runs of DOE. They are not well structured and high correlations (|r|~0.75) exist between each pairs of factors. Is there any way we can quickly find the group of DOE that has the lowest correlations? For example, list the maximum correlations between main effect factors from 1-30 runs of DOE and I can pick up the number of DOE I prefer. Maybe it will tell me that, out of 30 DOEs, these 16 DOEs have the lowest correlations (~0) for main effects.
I want to do augment DOE next after I remove some highly correlated DOE. Thanks!
Accepted Solutions
- Mark as New
- Bookmark
- Subscribe
- Mute
- Subscribe to RSS Feed
- Get Direct Link
- Report Inappropriate Content
Re: How to find the best combination of existing historical DOEs with lowest correlations (JMP17)?
Hi @Fruit325 ,
How is this new post different from the earlier one posted (and answers from Phil and I) ? : Opposite to augment DOE, hou could I quickly determine the DOE I need to remove to maximize the D-ef...
- To find correlations between factors, you could use the Multivariate platform and specify the DoE ID with the "by" variable to visualize the correlations between factors for each DoE datasets.
- To select the most interesting (non correlated) runs from all your DoEs runs in the global datatable, you could use Custom design and use the runs as covariate runs, and create a design with Alias-optimality criterion, aimed at minimizing the aliasing between effects that are in the assumed model and effects that are not in the model but are potentially active : Optimality Criteria (jmp.com)
- As mentioned by @Phil_Kay, it might be more useful to Augment Designs to improve correlations between factors and get a more useful model and data collection, instead of reducing your dataset. If reducing your dataset, you can also combine it with augmented design to overcome the weaknesses of the design with only covariate runs, so both approaches could be combined, and runs from the original sets of DoE not used could be used as validation runs.
Hope these options and answer makes sense for you,
Scientific Expertise Engineer
L'Oréal - Data & Analytics
- Mark as New
- Bookmark
- Subscribe
- Mute
- Subscribe to RSS Feed
- Get Direct Link
- Report Inappropriate Content
Re: How to find the best combination of existing historical DOEs with lowest correlations (JMP17)?
Hi @Fruit325,
In the presence of correlation between your factors, the use of optimal designs (D-, A- or Alias-) with the covariates runs from your DoE will help select the most dissimilar and non-correlated runs.
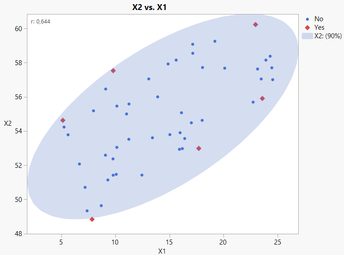
Here is an example with 50 data points, only 2 factors (for visualization and understanding purposes) with (high) correlation of 0,644 between X1 and X2 :
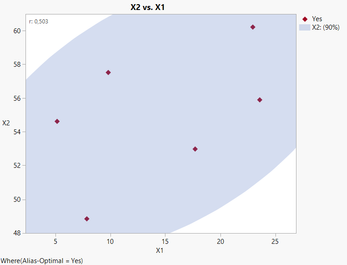
You can see that the selected red points correspond to a Alias-Optimal (same results with D-Optimal design) Custom design, and are chosen to be the most "spread out", helping reduce the correlation between X2 and X1 and estimate more precisely the main effects for X1 and X2 (despite the correlation).
In this example, the choice of a D- or Alias-optimal design doesn't make any change in the selected covariate runs, but with more factors (as it seems to be the case with your DoE datasets), using Alias-Optimal designs may prevent having correlations between effects in your model and potential effects not in your model (like interactions, quadratic or higher order effects).
I would still like to emphasize the need to separate analysis needs and data collection strategy: if you want to analyze the impact of correlated variables on responses, you can use appropriate modeling options with JMP (Principal Component Analysis, Partial Least Squares ...) or JMP Pro (using penalized regression techniques like Lasso, Ridge, Elastic Net, under the Generalized Regression Models (jmp.com) platform, or using Machine Learning models able to handle correlated variables like Bootstrap Forest), without the need to select/filter data points.
However in some cases, it's easier to spot patterns in a high quality small-size dataset than in a medium-quality big dataset.
Trying both options may be helpful to determine if the patterns found by these two options are similar and if they can be complementary to each others.
Hope this answer will help you,
Scientific Expertise Engineer
L'Oréal - Data & Analytics
- Mark as New
- Bookmark
- Subscribe
- Mute
- Subscribe to RSS Feed
- Get Direct Link
- Report Inappropriate Content
Re: How to find the best combination of existing historical DOEs with lowest correlations (JMP17)?
Hi @Fruit325 ,
How is this new post different from the earlier one posted (and answers from Phil and I) ? : Opposite to augment DOE, hou could I quickly determine the DOE I need to remove to maximize the D-ef...
- To find correlations between factors, you could use the Multivariate platform and specify the DoE ID with the "by" variable to visualize the correlations between factors for each DoE datasets.
- To select the most interesting (non correlated) runs from all your DoEs runs in the global datatable, you could use Custom design and use the runs as covariate runs, and create a design with Alias-optimality criterion, aimed at minimizing the aliasing between effects that are in the assumed model and effects that are not in the model but are potentially active : Optimality Criteria (jmp.com)
- As mentioned by @Phil_Kay, it might be more useful to Augment Designs to improve correlations between factors and get a more useful model and data collection, instead of reducing your dataset. If reducing your dataset, you can also combine it with augmented design to overcome the weaknesses of the design with only covariate runs, so both approaches could be combined, and runs from the original sets of DoE not used could be used as validation runs.
Hope these options and answer makes sense for you,
Scientific Expertise Engineer
L'Oréal - Data & Analytics
- Mark as New
- Bookmark
- Subscribe
- Mute
- Subscribe to RSS Feed
- Get Direct Link
- Report Inappropriate Content
Re: How to find the best combination of existing historical DOEs with lowest correlations (JMP17)?
Hi @Victor_G ,
Thanks a lot! From your previous answers I have already learned how to pick a number of DOE with D-optima design but I did not know what is alias optimal design at that time and I don't know it can be use to pick up correlation stuff. Does this only optimize the correlations between main effects and alias terms? How about the correlations between main effect terms, like X1 and X2? Is it possible for JMP to tell me the number of DOE group which has the lowest correlatons? Thank you! It helps a lot!
- Mark as New
- Bookmark
- Subscribe
- Mute
- Subscribe to RSS Feed
- Get Direct Link
- Report Inappropriate Content
Re: How to find the best combination of existing historical DOEs with lowest correlations (JMP17)?
Hi @Fruit325,
In the presence of correlation between your factors, the use of optimal designs (D-, A- or Alias-) with the covariates runs from your DoE will help select the most dissimilar and non-correlated runs.
Here is an example with 50 data points, only 2 factors (for visualization and understanding purposes) with (high) correlation of 0,644 between X1 and X2 :
You can see that the selected red points correspond to a Alias-Optimal (same results with D-Optimal design) Custom design, and are chosen to be the most "spread out", helping reduce the correlation between X2 and X1 and estimate more precisely the main effects for X1 and X2 (despite the correlation).
In this example, the choice of a D- or Alias-optimal design doesn't make any change in the selected covariate runs, but with more factors (as it seems to be the case with your DoE datasets), using Alias-Optimal designs may prevent having correlations between effects in your model and potential effects not in your model (like interactions, quadratic or higher order effects).
I would still like to emphasize the need to separate analysis needs and data collection strategy: if you want to analyze the impact of correlated variables on responses, you can use appropriate modeling options with JMP (Principal Component Analysis, Partial Least Squares ...) or JMP Pro (using penalized regression techniques like Lasso, Ridge, Elastic Net, under the Generalized Regression Models (jmp.com) platform, or using Machine Learning models able to handle correlated variables like Bootstrap Forest), without the need to select/filter data points.
However in some cases, it's easier to spot patterns in a high quality small-size dataset than in a medium-quality big dataset.
Trying both options may be helpful to determine if the patterns found by these two options are similar and if they can be complementary to each others.
Hope this answer will help you,
Scientific Expertise Engineer
L'Oréal - Data & Analytics
- © 2024 JMP Statistical Discovery LLC. All Rights Reserved.
- Terms of Use
- Privacy Statement
- About JMP
- JMP Software
- JMP User Community
- Contact


